Reeling from the 'airpocalypse' of deadly air pollution that attracted global media attention and sparked public outrage beginning in 2013, Beijing has made international headlines once again, but this time for the blue skies that have begun to reappear over the capital in 2018. The transformation is indicative of the government's fresh focus on environmental protection instead of unblinkered economic growth. At the behest of President Xi's famous pet phrase, "lucid waters and lush mountains are invaluable assets," the government has taken drastic measures to lay down the law.
To draw a picture of China's air quality progress, we tracked air quality data from the country's 31 major cities (27 provincial capital cities and four direct-governed municipalities) since the Air Pollution Prevention and Control Action Plan was introduced in 2013. Using this data, we analyzed air quality changes over the years.
Connecting the Dots Across the Map
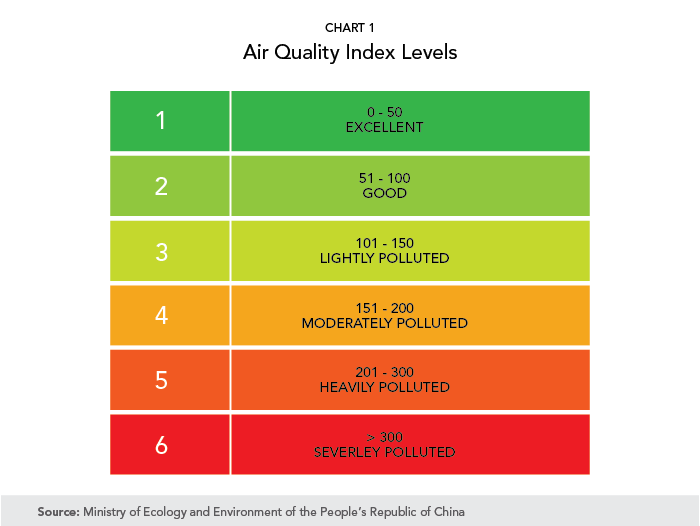
Along with a national plan to reduce air pollution, the Ministry of Environmental Protection (MEP), reorganized as the Ministry of Ecological Environment early this year, has adopted a new standard to measure air quality. The Air Quality Index (AQI) in China has six levels based on the amounts of six atmospheric pollutants. Up to level two, air quality is still considered acceptable: levels three and above are considered detrimental to public health (see Chart 1).
A common way to analyze overall AQI is by the number of days in a year that AQI is level two or better (chart 2). In 2016, Beijing still had a poor ranking in the bottom 10 with just over half of its days recording decent air quality. China has yet to publish its annual statistical yearbook for 2017, but the MEP has already praised Beijing for squeezing into the top ten earlier this year.

There has been a gradual general improvement in other cities too. In 2013, only four cities had more than 300 days of acceptable air quality, increasing to 22 cities in 2016. On the flip side, 22 out of the 31 cities suffered hazardous air quality for at least a third of the year in 2013, decreasing to only 11 cities in 2016.
The city with the largest improvement between 2013 and 2016 is Shijiazhuang, capital of the northern province of Hebei, where air quality improved by 250 per cent. Other cities showing notable improvement include Ji'nan and Tianjin, where air quality improved 113 per cent and 56 per cent respectively over the same period. Despite the commendable improvement, Shijiazhuang and Tianjin, together with Beijing, are still among the bottom ten in 2016; China still has a long way to go before people in many of the urban centres will be able to breathe safely without facemasks.
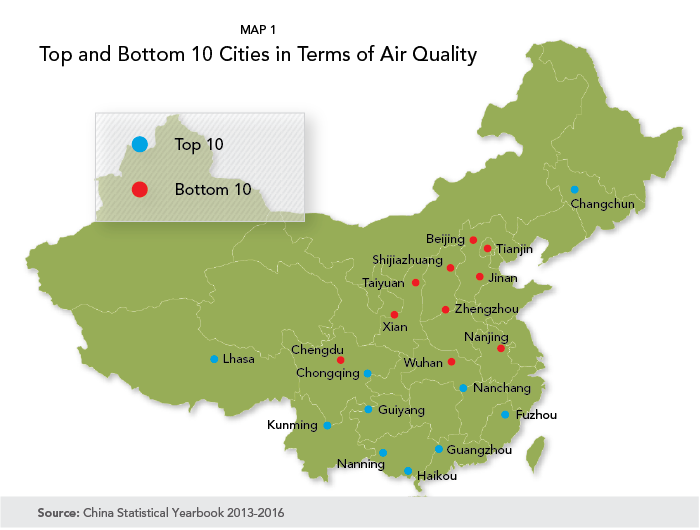
Looking at the cities geographically, we see on Map 1 (below) that the top ten cities with the best air quality (indicated in blue) lie in the south and southwest regions of China with the sole exception of Changchun, the capital city of China's northern province of Jilin. At the same time, the bottom ten cities (indicated in red) with the worst air quality are, not surprisingly, concentrated in northern regions historically more reliant on primary industries which use coal as a main source for heating and energy generation. The national capital region, dubbed Jingjinji, is composed of Beijing, Tianjin, and Shijiazhuang. These highly industrialized cities, not surprisingly, find themselves in the bottom ten rankings for air quality. An outlier to the geographical cluster is Chengdu, the capital of southwestern province of Sichuan.

The Invisible Assassins
China's economy has grown at an unprecedented pace over the past few decades, and it is widely accepted that economic growth came at the price of its environment and public health. One of the most direct dangers to public health is the 'airpocalyptic' smog. It is linked to nearly one-third of deaths in China.
The specific indicators tracked and analyzed for policy purposes are primary pollutants, substances directly emitted from a source, which include particulates (PM2.5 and PM10), sulfur dioxide (SO2), nitrogen dioxide (NO2), carbon monoxide (CO) and carbon dioxide (CO2), all directly generated by industrial and residential activities. Pollutants emitted by coal and oil-based heating and electricity generation, automobile exhaust, and construction and waste incineration go hand in hand with China's industrialization and urbanization efforts and are widely accepted as an unacceptable by-product of economic development. This makes the transition to renewable energy sources difficult. Moreover, to curb air pollution each city requires a unique scenario, tailored for its economic strengths and industry focuses.
New Perspective from the Eye of the Airpocalyptic Hurricane
After decades of GDP growth driven decisions, the Chinese government is now reflecting on the resulting environmental damage and destruction. More importantly, they are connecting environmental degradation to the health of China's citizens and economy. With the end of the Air Pollution Prevention and Control Action Plan in 2017, China implemented the Environmental Protection Tax Law on January 1, 2018, declaring air, water, solid waste and noise pollution a taxable emission. This tax not only designates 100 per cent of revenue to local government, it also increases the penalties for violating pollution standards.
These efforts signal to the world China's newfound commitment to environmental protection, however, air pollution is not a fight reserved for China alone. Last year South Korea launched a class action lawsuit against Beijing and Seoul, seeking compensation for its own worsening air quality. Even further across the ocean, China's smog has drifted to haunt the western states of the U.S. Researchers from Peking University found that the smog drifting to the U.S. from China is linked to Chinese exports destined for American consumers.
With Canada being a close neighbour to the U.S. and a likeminded outsourcer for manufacturing, Canada cannot escape the blame for China's air pollution either. In that sense, working with China to combat 'airpocalyptic' smog is not only good for China, but also good for Canada.
To gain a better understanding of the environmental protection performance of China's 31 'Tier 2' cities, visit our China Eco-City Tracker interactive data visualizer.
Also in APF Canada's new China Eco-City Tracker web series:
Click here to download a digital chapbook of the entire series, or read our blogs online, below . .
• China Eco-City Tracker: Web Series Introduction
• China Eco-City Tracker: A Clearing in the 'Airpocalypse' for China
• China Eco-City Tracker: The Upstream Battle for Drinkable Water
• China Eco-City Tracker: Tackling Trash Troubles with New Policies, Penalties
• China Eco-City Tracker: Lessons From the Danes and the Finns
• China Eco-City Tracker: Navigating the ‘Valley of Death’: Financing and Commercializing Canada’s Cleantech Industry
• China Eco-City Tracker: China's Clean Tech Commitment
• China Eco-City Tracker: China's Clean Tech Decision-making


